
Kuvatud on postitused sildiga Paper. Kuva kõik postitused
Kuvatud on postitused sildiga Paper. Kuva kõik postitused
Mine water as a potential source of energy from underground mined areas
Mine water as a potential source of energy from underground mined areas in Estonian oil shale deposit


Paper: Geotechnical Processes and Soil-Water Movement with Transport of Pollutants
Paper: Geotechnical Processes and Soil-Water Movement with Transport of Pollutants in the Estonian Oil Shale Mining Area
http://www.minest.ee/water
txt: GEOTECHNICAL PROCESSES AND SOIL-WATER MOVEMENT WITH TRANSPORT OF POLLUTANTS IN THE ESTONIAN OIL SHALE MINING AREA Tallinn Technical University, Department of Mining 82, Kopli Str., 10412 Tallinn, Estonia Abstract One of the most important industries of Northeast Estonia is oil shale mining. Ground movements caused by mining reach the ground surface easily due to shallow location of workings. A new, artificial topography is formed on undermined areas, where the ground surface depressions are alternating with rising grounds. When the Quaternary cover contains loamy sediments, the surface water will accumulate in the depressions. The response of usable lands on undermined areas depends on the degree of changes in the relief and water regime. The accumulation of solid residues by oil shale mines and processing plants has resulted in numerous ash hills, which are polluting the environment. The streams are polluted by phenols, oil products and sulphates. The main source of water supply is groundwater in the oil shale basin. The hydrostratigraphic section is represented by three aquifers. Two (Quaternary and Ordovician) of these aquifers are affected by the human activity. Intensive water consumption has caused a fall in the water level in these aquifers. Due to oil shale production the concentration of Ca2+, Mg2+, SO4 2- and Cl contained in the groundwater from the Ordovician deposits is noticeably higher than in the water with a natural background level. The natural water chemical regime is restored at the cessation of mining. Introduction Estonia is situated on the shore of the Gulf of Finland (Fig. 1) and is characterised by flat topography with only slight differences in elevation. Gulf of Finland Estonia Russia 20 kilometers 0 10 Narva Sirgala Estonia Kohtla - Järve ash dumps Kiviõli ash dumps Kohtla-Järve Sompa Tammiku Ahtme Kukruse Viru Sillamäe Mined out area Claims of oil shale mines Ash dumps Oil Shale outcrop ESTONIA LUXEMBOURG IRELAND DENMARK ANDORRA MONACO LIECHTENSTEIN BOSNIA AND HERZEGOVINA FR. YUGO. REPUB. OF MACEDONIA ARMENIA ICELAND LATVIA MOLDOVA LITHUANIA SLOVENIA PORTUGAL NETHERLANDS FRANCE SPAIN FINLAND NORWAY SWEDEN GREECE ROMANIA UKRAINE SLOVAKIA CZECH REPUBLIC POLAND BELARUS RUSSIA GEORGIA MALTA Fig. 1 Location map of Estonian oil shale deposit. Oil shale reserves are concentrated in North-East Estonia (Fig. 1) and make up about 3,8 billion tons, half of which can be mined according to existing technology, economical and ecological criteria. The annually exploitable layers have an average thickness of 2,6 m and the bedding depth increasing in the southern direction. Oil shale consists of 30-40% organic (kerogen) and 60-70% mineral matter (mainly carbonates and sandy-clayey minerals). The sulphur content averages 1,6 %, the net calorific value varies from 6-10 MJ/kg. Oil shale output increased from 2 million tons in 1940 to 31 million t in 1980, and has since decreased to 12 million tons (Fig. 2). 0 5 10 15 20 25 30 35 1920 1940 1960 1980 2000 2020 Output, Mt per year Output Forecast Fig. 2 Estonian oil shale annual production (mining output) and forecast by Enno Reinsalu (Reinsalu, 1998) The study object was of 290 km2 underground and 130 km2 strip mined area (Valgma, 2002). Oil shale is presently excavated in two surface and two underground mines. For excavation oil shale the mines must be dewatering. The mine water pumped up the oil shale underground and surface mines and discharged into rivers forms on the average 86% (quantitatively 159- 226 millions m3 /yr). In the region of oil shale mining on an average 15 million m3 of water is being pumped out of mines monthly (Fig. 3). Mines drainage causes the depletion of ground- 0 5 10 15 20 25 30 35 40 45 January February March April May June July August September October November December million m3/month 1999 2000 2001 2002 Fig. 3 Water, which pumped out of surface and underground mines monthly water, resulting in drawdown of 20 m in the northern and 70 m in the southern part of mining area. The infiltration of contaminants grows and the main aquifers are chemically polluted over a large area. The formation of the chemical composition of water is influenced by considerable variation of hydraulic conductivity, numerous faults in the strata, karst and, in addition, depressions forming during mining. Evidently each singular case represents a plurality of underlying causes and hence a considerable variety of analytical results depending on the location and season of sampling. Methods During years 1998...2001 geotechnical processes of closed underground oil shale mines and opencasts were investigated. A digital map of Estonian oil shale mining was created for joining data of technological, environmental, and social limitations in the deposit. The main objective was the stability of underground mined area. The stability was studied with help of aerial photographs, mine drawings, maps of quaternary sediments and mathematical modelling of rock failure. Water sampling took place during the spring and summer from 1988 to 1990. This period samples were from tectonic faults and karst fissures in mines, and also from pumped public supply or private boreholes. Springs and rivers were also sampled to obtain a reasonably complete hydrochemical understanding of the hydrogeological cycle in this area. The chemical analysis from more than 20 constituents was carried out on water samples from each of the 31 sampling sites. From Eesti Põlevkivi Ltd. and Estonian Geological Survey were received the official data for the period 1991-2002 and these are following: annual amounts of mine waters, chemical content of water, annual influxes of sulphates with mine waters, data of water regime, the chemical content of ash dumps water. Results The main influences of underground mining on the surface are spontaneous collapses and subsidences. Subsided land is located above hand-mined, advancing-and-retreating mining and longwall mining with double-unit-face areas. The relief of subsided land depends on the quantity of the filling material and filling quality, and on roof structure. Information was collected mainly about random spontaneous collapses of drifts and spontaneous collapses of room-and-pillar mining. Some information is collected about induced caving of longwall mining in Kohtla mine. Considering that longwall mining was stopped in the Estonian deposit in the year 2001, the information about induced caving should be collected and analysed as well. The area of subsidence moulds is in average 55600 m2 ranging from 2500 to 152500 m2 in total. There are 3.1 km2 subsidence areas. Some of the spontaneous collapses mentioned by mining surveyors cannot be recognized on the surface and some seen on the surface have not been reported. In these cases the fieldwork was done with GPS device and caving possibilities considered with the help of digital maps. Cavings have been found in the areas where mines operated within the period of 1963...1989. Surface mining mapping included digitising haulage and mining trenches, loading points, dewatering constructions like ditches, basins and tunnels. Besides, yearly mining ranges were digitised. Created database includes geological characteristics and data of the used technology. Map of yearly mining ranges offers a good overview of the mining period, speed and extent. The present open-cast landscapes can be divided into four classes. The first one is the afforested (mainly with pines) area. The second one is the area with poor vegetation, small trees and bushes, fifty per cent of it being a rocky surface. The third one is a graded area, mainly without vegetation but ready for planting. The fourth area has spoils that are not graded and have no vegetation; their surface angles are reaching the angle of the repose, maximum 45o. One year stripping equals 1-3 trenches. As an example, the former Narva open-cast has been modelled. Digital elevation model (DEM) was created from geological, topological and mining data. There are two principal types of spoils in open cast mined areas. First is formed by beginning mining technology in 1925 to 1950. Oil shale layers were mined by handwork and overburden was stripped by 3 m3 steam excavator in cooperation with spreader. The width of the mining pit was 20 m, forming spoils with maximum slopes 20o. The thickness of the oil shale layer was 2.6 m and the overburden thickness varied from 5 to 12 m. Average stripping factor was 1.9 m3 t-1. Due to this, average height of the ground in the mined out area is from 0 to 2 m below original ground surface, forming deeper and higher peaks. Depending on that, the moisture content of spoil might be higher than that of the soil in the same area before mining. Since spreader and mechanical shovel were used for stripping, the estimated swell factor of the material was 1.3. Maximum size of the material could be 1.4 m due to bucket size and average size was 150 mm. Because of low mobility of the spreader and missing reclamation requirements, the unevenness of the spoil varies between 0.5 and 2 m. The content of organic matter in the spoil, originating from kukersite oil shale, is on average 4%–6%. That material is evenly spaced in the spoils due to stripping method. The second type is mined with newer technology beginning from 1950ties. The area was mainly covered with swampy forests and bogs. Oil shale layers were mined by blasting and overburden was blasted and stripped by 15 m3 and 90 m long boom draglines. The width of the mining pit was 50 m, forming spoils with maximum slopes 3o. The thickness of the oil shale layer was 2.0 m and the overburden thickness varied from 11 to 17 m. Average stripping factor was 4.1 m3 t-1. Due to this, average height of the ground in the mined out area is about 2 to 4 m above the original ground surface. Depending on higher surface than natural and water pumping due to operating open cast, the moisture content and seepage of the spoil might be lower than in the first area. Organic part of the left oil shale layers is mostly in bottom. Dragline and in some cases mechanical shovel were used for stripping of blasted overburden rock, therefore the swell factor of the material was 1.4. Maximum size of the material is 3.1 m due to bucket size and average size was 300 mm. Unevenness of the spoil ranges from 0.5 to 1.5 m on average, but it can be up to 6 m in test sections. The content of organic matter in the structure of spoils, originating from kukersite oil shale, is on average 2% being 4% in bottom and 1% in surface of the spoil. Due to stripping method the material is unevenly spaced in the spoils, the estimated swell factor is up to 1.5 in the bottom. This is another reason for water runoff from the spoils. Because of several mines are being closed during next few years the problems of drowned waste are going to be more actual than before: increase of underground water level, underground water pollution, technogenic water sources and over flooding of reclaimed areas. The chemical analyses of groundwater divide into two principal groups (Fig. 4): - a very large group of CaHCO3 waters; - a large group of Mg(Ca)SO4(HCO3) waters. 0 100 200 300 400 500 600 700 mg/l underlying 7 4 67 17 309 10 10 overlying 10 9 59 30 356 10 9 closed mine (Tammiku, Sompa, Kukruse, Ahtme) 30 7 181 47 385 370 36 working mines (Estonia, Viru) 20 10 156 50 427 620 57 surface mines (Sirgala, Narva) 12 8 174 55 353 530 35 Na K Ca Mg HCO3 SO4 Cl Figure 4. Chemical compositions of groundwater and mining water The influence of groundwater consumption, dewatering of surface and underground mines on the groundwater regime was evident. In the course of oil shale mining at the Estonian oil shale deposit three stages of Ordovician aquifer system have been partially or totally drained. The observation data show that all the aquifers are interconnected and oil shale mining exerts a remarkable influence on all of them. Contamination in this region is mostly due to pollution caused by power and chemical industries. Studies of ash hills demonstrate that the ash may be highly enriched in certain potentially toxic elements, typically semi-volatiles, such as boron, arsenic, antimony etc. The ash dumps water (Table 1) is typically rich in oxides and may have an extremely high (alkaline) pH, which may render some metallic or semi-metallic species highly mobile. Table 1. The composition of the ash dumps water Content, g/m3 Pollutants Interval Maximum Chemical oxygen demand (COD) 4000-8000 18000 Biochemical oxygen demand (BOD) 2500-4000 6400 Phenols 200-580 1400 Volatile phenols 80-110 150 Oil products 30-70 100 Benzo(a)pyrene, g kg-1 0.05-0.15 0.22 Sulphides 100-230 270 Dry matter 3500-6000 7300 Suspended solids 300-600 1300 Total hardness, eqv m-3 30-47 53 pH 11.4-12.2 12.5 There is increasing evidence that portions of the water infiltrating through the soil surface may move rapidly through the aeration zone along preferred flow paths such as macropores and fractures. This rapid, concentrated flow may also have significant implications for the transport of pollutants to the groundwater body. Discharge into the macropores and the concentrated groundwater recharge in the vicinity of the macropores occurred in relation to the development of the groundwater mound. Incorporation of the soil-water movement would bring better prediction of the time, location and magnitude of groundwater pollution due to the transport of pollutants by the infiltrating water. Discussion The basic processes that determine the chemical composition of water in the samples can be classified as follows: - chemical composition of water in the structurally undamaged aquifers; - chemical processes taking place in the sites of tectonic damage and erosion; - infiltration of groundwater (atmospheric precipitations and extracted water) through loading layers; - man-made changes in the environment. As a result of the combined influence of these processes the natural bicarbonate-type water, characteristic of the Ordovician aquifer of the given region, has changed into sulphate- bicarbonate water, having increased from 0,2...0,3 g to 1,0 g/l. Essential role in the formation of the chemical composition of water, especially in shaping local singularities, is played by tectonic damages and karst; in that case the value of the hydraulic conductivity increases. In the regions where tectonic faults are widespread general mineralization may be twice as high as that usually characteristic of water aquifer. Concentrations of Na+ , Ca2+ and Cl are also much higher. Very significant part in the formation of the chemical composition of waters is played by depressions that have sprung up in the course of mining. Their impact is two-hold: infiltration and water exchange increase significantly and with the alteration of aeration conditions a geochemical environment with new physical-chemical properties is formed. Conclusions Natural hydrogeological conditions in Northeast Estonia were simple, but they have been disturbed by the mining industry and consumption of the groundwater. Deeply fractured carbonates, together with effects of mining, have facilitated the rapid spread of aquatic pollution. Mineralised mine water extraction is useless, and the reduction of its mineralization level by technological means or natural filter systems is a problem which needs tackling in the near future. Today this water is guided to natural water bodies. As the content of sulphates in mining waters is high, the concentration of sulphates in the bottom sediments of many water bodies has risen sharply. Due to strong eutrophication there is an oxygen deficiency in some places and the reduction of sulphates to toxic H2S already occurs. The study was supported by EstSF GRANTs G3403 and G4870. Bibliography 1. Reinsalu, E. Is Estonian oil shale beneficial in future? Oil Shale, 15/2, 1998, 97-101. 2. Valgma, I. Estonian oil shale resources calculated by GIS-method. Symposium on Oil Shale., Tallinn, Estonia, 18-21 November 2002
http://www.minest.ee/water
txt: GEOTECHNICAL PROCESSES AND SOIL-WATER MOVEMENT WITH TRANSPORT OF POLLUTANTS IN THE ESTONIAN OIL SHALE MINING AREA Tallinn Technical University, Department of Mining 82, Kopli Str., 10412 Tallinn, Estonia Abstract One of the most important industries of Northeast Estonia is oil shale mining. Ground movements caused by mining reach the ground surface easily due to shallow location of workings. A new, artificial topography is formed on undermined areas, where the ground surface depressions are alternating with rising grounds. When the Quaternary cover contains loamy sediments, the surface water will accumulate in the depressions. The response of usable lands on undermined areas depends on the degree of changes in the relief and water regime. The accumulation of solid residues by oil shale mines and processing plants has resulted in numerous ash hills, which are polluting the environment. The streams are polluted by phenols, oil products and sulphates. The main source of water supply is groundwater in the oil shale basin. The hydrostratigraphic section is represented by three aquifers. Two (Quaternary and Ordovician) of these aquifers are affected by the human activity. Intensive water consumption has caused a fall in the water level in these aquifers. Due to oil shale production the concentration of Ca2+, Mg2+, SO4 2- and Cl contained in the groundwater from the Ordovician deposits is noticeably higher than in the water with a natural background level. The natural water chemical regime is restored at the cessation of mining. Introduction Estonia is situated on the shore of the Gulf of Finland (Fig. 1) and is characterised by flat topography with only slight differences in elevation. Gulf of Finland Estonia Russia 20 kilometers 0 10 Narva Sirgala Estonia Kohtla - Järve ash dumps Kiviõli ash dumps Kohtla-Järve Sompa Tammiku Ahtme Kukruse Viru Sillamäe Mined out area Claims of oil shale mines Ash dumps Oil Shale outcrop ESTONIA LUXEMBOURG IRELAND DENMARK ANDORRA MONACO LIECHTENSTEIN BOSNIA AND HERZEGOVINA FR. YUGO. REPUB. OF MACEDONIA ARMENIA ICELAND LATVIA MOLDOVA LITHUANIA SLOVENIA PORTUGAL NETHERLANDS FRANCE SPAIN FINLAND NORWAY SWEDEN GREECE ROMANIA UKRAINE SLOVAKIA CZECH REPUBLIC POLAND BELARUS RUSSIA GEORGIA MALTA Fig. 1 Location map of Estonian oil shale deposit. Oil shale reserves are concentrated in North-East Estonia (Fig. 1) and make up about 3,8 billion tons, half of which can be mined according to existing technology, economical and ecological criteria. The annually exploitable layers have an average thickness of 2,6 m and the bedding depth increasing in the southern direction. Oil shale consists of 30-40% organic (kerogen) and 60-70% mineral matter (mainly carbonates and sandy-clayey minerals). The sulphur content averages 1,6 %, the net calorific value varies from 6-10 MJ/kg. Oil shale output increased from 2 million tons in 1940 to 31 million t in 1980, and has since decreased to 12 million tons (Fig. 2). 0 5 10 15 20 25 30 35 1920 1940 1960 1980 2000 2020 Output, Mt per year Output Forecast Fig. 2 Estonian oil shale annual production (mining output) and forecast by Enno Reinsalu (Reinsalu, 1998) The study object was of 290 km2 underground and 130 km2 strip mined area (Valgma, 2002). Oil shale is presently excavated in two surface and two underground mines. For excavation oil shale the mines must be dewatering. The mine water pumped up the oil shale underground and surface mines and discharged into rivers forms on the average 86% (quantitatively 159- 226 millions m3 /yr). In the region of oil shale mining on an average 15 million m3 of water is being pumped out of mines monthly (Fig. 3). Mines drainage causes the depletion of ground- 0 5 10 15 20 25 30 35 40 45 January February March April May June July August September October November December million m3/month 1999 2000 2001 2002 Fig. 3 Water, which pumped out of surface and underground mines monthly water, resulting in drawdown of 20 m in the northern and 70 m in the southern part of mining area. The infiltration of contaminants grows and the main aquifers are chemically polluted over a large area. The formation of the chemical composition of water is influenced by considerable variation of hydraulic conductivity, numerous faults in the strata, karst and, in addition, depressions forming during mining. Evidently each singular case represents a plurality of underlying causes and hence a considerable variety of analytical results depending on the location and season of sampling. Methods During years 1998...2001 geotechnical processes of closed underground oil shale mines and opencasts were investigated. A digital map of Estonian oil shale mining was created for joining data of technological, environmental, and social limitations in the deposit. The main objective was the stability of underground mined area. The stability was studied with help of aerial photographs, mine drawings, maps of quaternary sediments and mathematical modelling of rock failure. Water sampling took place during the spring and summer from 1988 to 1990. This period samples were from tectonic faults and karst fissures in mines, and also from pumped public supply or private boreholes. Springs and rivers were also sampled to obtain a reasonably complete hydrochemical understanding of the hydrogeological cycle in this area. The chemical analysis from more than 20 constituents was carried out on water samples from each of the 31 sampling sites. From Eesti Põlevkivi Ltd. and Estonian Geological Survey were received the official data for the period 1991-2002 and these are following: annual amounts of mine waters, chemical content of water, annual influxes of sulphates with mine waters, data of water regime, the chemical content of ash dumps water. Results The main influences of underground mining on the surface are spontaneous collapses and subsidences. Subsided land is located above hand-mined, advancing-and-retreating mining and longwall mining with double-unit-face areas. The relief of subsided land depends on the quantity of the filling material and filling quality, and on roof structure. Information was collected mainly about random spontaneous collapses of drifts and spontaneous collapses of room-and-pillar mining. Some information is collected about induced caving of longwall mining in Kohtla mine. Considering that longwall mining was stopped in the Estonian deposit in the year 2001, the information about induced caving should be collected and analysed as well. The area of subsidence moulds is in average 55600 m2 ranging from 2500 to 152500 m2 in total. There are 3.1 km2 subsidence areas. Some of the spontaneous collapses mentioned by mining surveyors cannot be recognized on the surface and some seen on the surface have not been reported. In these cases the fieldwork was done with GPS device and caving possibilities considered with the help of digital maps. Cavings have been found in the areas where mines operated within the period of 1963...1989. Surface mining mapping included digitising haulage and mining trenches, loading points, dewatering constructions like ditches, basins and tunnels. Besides, yearly mining ranges were digitised. Created database includes geological characteristics and data of the used technology. Map of yearly mining ranges offers a good overview of the mining period, speed and extent. The present open-cast landscapes can be divided into four classes. The first one is the afforested (mainly with pines) area. The second one is the area with poor vegetation, small trees and bushes, fifty per cent of it being a rocky surface. The third one is a graded area, mainly without vegetation but ready for planting. The fourth area has spoils that are not graded and have no vegetation; their surface angles are reaching the angle of the repose, maximum 45o. One year stripping equals 1-3 trenches. As an example, the former Narva open-cast has been modelled. Digital elevation model (DEM) was created from geological, topological and mining data. There are two principal types of spoils in open cast mined areas. First is formed by beginning mining technology in 1925 to 1950. Oil shale layers were mined by handwork and overburden was stripped by 3 m3 steam excavator in cooperation with spreader. The width of the mining pit was 20 m, forming spoils with maximum slopes 20o. The thickness of the oil shale layer was 2.6 m and the overburden thickness varied from 5 to 12 m. Average stripping factor was 1.9 m3 t-1. Due to this, average height of the ground in the mined out area is from 0 to 2 m below original ground surface, forming deeper and higher peaks. Depending on that, the moisture content of spoil might be higher than that of the soil in the same area before mining. Since spreader and mechanical shovel were used for stripping, the estimated swell factor of the material was 1.3. Maximum size of the material could be 1.4 m due to bucket size and average size was 150 mm. Because of low mobility of the spreader and missing reclamation requirements, the unevenness of the spoil varies between 0.5 and 2 m. The content of organic matter in the spoil, originating from kukersite oil shale, is on average 4%–6%. That material is evenly spaced in the spoils due to stripping method. The second type is mined with newer technology beginning from 1950ties. The area was mainly covered with swampy forests and bogs. Oil shale layers were mined by blasting and overburden was blasted and stripped by 15 m3 and 90 m long boom draglines. The width of the mining pit was 50 m, forming spoils with maximum slopes 3o. The thickness of the oil shale layer was 2.0 m and the overburden thickness varied from 11 to 17 m. Average stripping factor was 4.1 m3 t-1. Due to this, average height of the ground in the mined out area is about 2 to 4 m above the original ground surface. Depending on higher surface than natural and water pumping due to operating open cast, the moisture content and seepage of the spoil might be lower than in the first area. Organic part of the left oil shale layers is mostly in bottom. Dragline and in some cases mechanical shovel were used for stripping of blasted overburden rock, therefore the swell factor of the material was 1.4. Maximum size of the material is 3.1 m due to bucket size and average size was 300 mm. Unevenness of the spoil ranges from 0.5 to 1.5 m on average, but it can be up to 6 m in test sections. The content of organic matter in the structure of spoils, originating from kukersite oil shale, is on average 2% being 4% in bottom and 1% in surface of the spoil. Due to stripping method the material is unevenly spaced in the spoils, the estimated swell factor is up to 1.5 in the bottom. This is another reason for water runoff from the spoils. Because of several mines are being closed during next few years the problems of drowned waste are going to be more actual than before: increase of underground water level, underground water pollution, technogenic water sources and over flooding of reclaimed areas. The chemical analyses of groundwater divide into two principal groups (Fig. 4): - a very large group of CaHCO3 waters; - a large group of Mg(Ca)SO4(HCO3) waters. 0 100 200 300 400 500 600 700 mg/l underlying 7 4 67 17 309 10 10 overlying 10 9 59 30 356 10 9 closed mine (Tammiku, Sompa, Kukruse, Ahtme) 30 7 181 47 385 370 36 working mines (Estonia, Viru) 20 10 156 50 427 620 57 surface mines (Sirgala, Narva) 12 8 174 55 353 530 35 Na K Ca Mg HCO3 SO4 Cl Figure 4. Chemical compositions of groundwater and mining water The influence of groundwater consumption, dewatering of surface and underground mines on the groundwater regime was evident. In the course of oil shale mining at the Estonian oil shale deposit three stages of Ordovician aquifer system have been partially or totally drained. The observation data show that all the aquifers are interconnected and oil shale mining exerts a remarkable influence on all of them. Contamination in this region is mostly due to pollution caused by power and chemical industries. Studies of ash hills demonstrate that the ash may be highly enriched in certain potentially toxic elements, typically semi-volatiles, such as boron, arsenic, antimony etc. The ash dumps water (Table 1) is typically rich in oxides and may have an extremely high (alkaline) pH, which may render some metallic or semi-metallic species highly mobile. Table 1. The composition of the ash dumps water Content, g/m3 Pollutants Interval Maximum Chemical oxygen demand (COD) 4000-8000 18000 Biochemical oxygen demand (BOD) 2500-4000 6400 Phenols 200-580 1400 Volatile phenols 80-110 150 Oil products 30-70 100 Benzo(a)pyrene, g kg-1 0.05-0.15 0.22 Sulphides 100-230 270 Dry matter 3500-6000 7300 Suspended solids 300-600 1300 Total hardness, eqv m-3 30-47 53 pH 11.4-12.2 12.5 There is increasing evidence that portions of the water infiltrating through the soil surface may move rapidly through the aeration zone along preferred flow paths such as macropores and fractures. This rapid, concentrated flow may also have significant implications for the transport of pollutants to the groundwater body. Discharge into the macropores and the concentrated groundwater recharge in the vicinity of the macropores occurred in relation to the development of the groundwater mound. Incorporation of the soil-water movement would bring better prediction of the time, location and magnitude of groundwater pollution due to the transport of pollutants by the infiltrating water. Discussion The basic processes that determine the chemical composition of water in the samples can be classified as follows: - chemical composition of water in the structurally undamaged aquifers; - chemical processes taking place in the sites of tectonic damage and erosion; - infiltration of groundwater (atmospheric precipitations and extracted water) through loading layers; - man-made changes in the environment. As a result of the combined influence of these processes the natural bicarbonate-type water, characteristic of the Ordovician aquifer of the given region, has changed into sulphate- bicarbonate water, having increased from 0,2...0,3 g to 1,0 g/l. Essential role in the formation of the chemical composition of water, especially in shaping local singularities, is played by tectonic damages and karst; in that case the value of the hydraulic conductivity increases. In the regions where tectonic faults are widespread general mineralization may be twice as high as that usually characteristic of water aquifer. Concentrations of Na+ , Ca2+ and Cl are also much higher. Very significant part in the formation of the chemical composition of waters is played by depressions that have sprung up in the course of mining. Their impact is two-hold: infiltration and water exchange increase significantly and with the alteration of aeration conditions a geochemical environment with new physical-chemical properties is formed. Conclusions Natural hydrogeological conditions in Northeast Estonia were simple, but they have been disturbed by the mining industry and consumption of the groundwater. Deeply fractured carbonates, together with effects of mining, have facilitated the rapid spread of aquatic pollution. Mineralised mine water extraction is useless, and the reduction of its mineralization level by technological means or natural filter systems is a problem which needs tackling in the near future. Today this water is guided to natural water bodies. As the content of sulphates in mining waters is high, the concentration of sulphates in the bottom sediments of many water bodies has risen sharply. Due to strong eutrophication there is an oxygen deficiency in some places and the reduction of sulphates to toxic H2S already occurs. The study was supported by EstSF GRANTs G3403 and G4870. Bibliography 1. Reinsalu, E. Is Estonian oil shale beneficial in future? Oil Shale, 15/2, 1998, 97-101. 2. Valgma, I. Estonian oil shale resources calculated by GIS-method. Symposium on Oil Shale., Tallinn, Estonia, 18-21 November 2002
Possibilities of mining under the mire
Paper: Possibilities of oil shale mining under the Selisoo mire of the Estonian oil shale deposit
txt: See discussions, stats, and author profiles for this publication at: https://www.researchgate.net/publication/236005585 Possibilities of oil shale mining under the Selisoo mire of the Estonia oil shale deposit Article in Environmental Earth Sciences · December 2013 DOI: 10.1007/s12665-013-2396-x CITATIONS 17 READS 98 5 authors, including: Some of the authors of this publication are also working on these related projects: Rikastamine View project Vivika Väizene Tallinn University of Technology 91 PUBLICATIONS 250 CITATIONS SEE PROFILE Juri-Rivaldo Pastarus Tallinn University of Technology 36 PUBLICATIONS 61 CITATIONS SEE PROFILE Ylo also Ülo also in Russian Юло Joann Systr… Tallinn University of Technology 15 PUBLICATIONS 45 CITATIONS SEE PROFILE Ingo Valgma Tallinn University of Technology 404 PUBLICATIONS 1,503 CITATIONS SEE PROFILE All content following this page was uploaded by Ingo Valgma on 11 March 2015. The user has requested enhancement of the downloaded file. All in-text references underlined in blue are added to the original document and are linked to publications on ResearchGate, letting you access and read them immediately. Look Inside Get Access Find out how to access previewonly content Environmental Earth Sciences December 2013, Volume 70, Issue 7, pp 33113321 Date: 27 Mar 2013 Possibilities of oil shale mining under the Selisoo mire of the Estonia oil shale deposit Abstract The paper presents results of the study on oil shale mining (Estonia underground mine) possibilities under the Selisoo mire. The Selisoo area is 2,051 ha in extent, and most of the mire is in natural state. Peat layer consists of thick (4.4–6.5 m) oligotrophic peat. Mining under Selisoo will go at depths 65– 70 m under the surface. The mining field of the Estonia mine was planned between Ahtme and Viivikonna fault zones. The lowest hydraulic conductivity of carbonate rocks 0.11 l/day per m2 is found in the Oandu layer and for peat it is 0.35–0.0002 m/day. Therefore, together they form a good aquitard. When the annual rainfall amount is the highest, the difference between horizontal water inflow and runoff is positive with 127,000 m3 . Positive water balance is guaranteed in case of precipitation being at least 540 mm/year. The positive water balance is important for preserving the ecological system of Selisoo mire. For guaranteeing longterm stability of mine pillars, a new calculation method has been elaborated, based on the conventional calculation scheme, where the factor of safety is more than 2.3. Rheological processes are out of question, collapse of the pillars is impossible. Stability of the underground constructions and overburden rocks must be “eternal”. The criteria were elaborated for oil shale mining and will guarantee preservation of mires in natural or close to natural state. Article Metrics Citations 5 Social Shares References (52) 1. Botch MS, Masing VV (1979) Ecosystems of USSR. Nauka, Leningrad. [in Russian] 2. Fetter CW (1994) Applied hydrogeology, 3rd edn. Macmillan College Publishing Company, Inc, New York, Library of Congress CataloginginPublication Data, pp 1– 691 3. Hints L (1997) Aseri Stage Lasnamägi Stage Uhaku Stage Kukruse Stage Haljala Stage. In: Raukas A, Teedumäe A (eds) Geology and mineral resources of Estonia. Estonian Academy Publishers, Tallinn, pp 66–72 4. Hints L, Meidla T (1997) Keila Stage Oandu Stage Rakvere Stage Nabala Stage. In: Teedumäe A, Raukas A (eds) Geology and mineral resources of Estonia. Estonian Academy Publishers, Tallinn, pp 74–81 5. Huang S, Li X, Wang Y (2012) A new model of geoenvironmental impact assessment of mining: a multiplecriteria assessment method integrating FuzzyAHP with fuzzy synthetic ranking. Environ Earth Sci 66(1):275–284. doi:10.1007/s126650111237z CrossRef 6. Ivanov KE (1975) Water exchange in peatlands. Gidrometeoizdat, Leningrad, pp 86–91 [in Russian] 7. Joosten H, Clark D (2002) Wise use of mires and peatlands. International Mire Conservation Group, International Peat Society, Saarijärvi, p 303 8. Jõgar P (1983) Groundwater flow models of Pandivere Upland (northeast Estonia). In: Proceedings of academy of sciences of ESSR. Geology 32, 2, 69–78 [In Russian, summary in English] 9. Karu V, Västrik A, Anepaio A, Väizene V, Adamson A, Valgma I (2008) Future of oil shale mining technology in Estonia. Oil Shale 25(2S):125–134 CrossRef 10. Kattai V, Vingisaar P (1980) Structure of the Ahtme tectonic disturbance. In: Proceeding of the academy of sciences ESSR. Geology 29, 2, 55–62 [In Russian, summary in English abstract] 11. Ketcheson SJ, Price JS (2011) The impact of peatland restoration on the site hydrology of an abandoned blockcut bog. Wetlands 31(6):1263–1274. doi:10.1007/s13157011 02410 CrossRef 12. Kink H (1997) Karst and springs. In: Teedumäe A, Raukas A (eds) Geology and mineral resources of Estonia. Estonian Academy Publishers, Tallinn, pp 389–390 13. Koitmets K, Reinsalu E, Valgma I (2003) Precision of oil shale energy rating and oil shale resources. Oil Shale 20(1):15–24 14. Loopmann A (1996) Formation, development and perishing of mire massis. Development of mires and formation of bedpool complex. J Estonian Peat 3(4):18–21 [in Estonian, with English summary] 15. Lu W, Luo Y, Chen M et al (2012) An introduction to Chinese safety regulations for blasting vibration. Environ Earth Sci 67(7):1951–1959. doi:10.1007/s1266501216369 CrossRef 16. Mininglaw and legal regulation acts (1998) Ministry of Environment, Ministry of Economy. Part II, Tallinn, (in Estonian) 17. Nestor H, Soesoo A, Linna A, Hints O, Nõlvak J (2007) Ordovician in Estonia and southern Finland. MTÜ GEOGuide Baltoscandia, Tallinn, pp 1–32 18. Niinemets E, Pensa M, Charman D (2011) Analysis of fossil testate amoebae along the hummocklawnhollow gradient in Selisoo Bog, Estonia: local variability and implications for palaeoecological reconstructions in peatlands. Boreas 40:367–378 19. Orru H, Orru M (2006) Sources and distribution of trace elements in Estonian peat. Symposium on peatlands—basin evolution and depository of records on global environmental and climatic changes location: Florence, Italy. Glob Planet Change 53(4):249–258. doi:10.1016/j.gloplacha.2006.03.007 CrossRef 20. Orru M (1975) Report of explorationinvestigation works of peat deposits in KohtlaJärve County. Manuscript at depository of manuscript reports of geological survey of Estonia. Geological survey of Estonia, Tallinn (in Estonian, with Russian summary) 21. Orru M (1995) Estonian mires. Geological Survey of Estonia, Tallinn (in Estonian, with English summary) 22. Orru M (2010) Dependence of Estonian Peat deposit properties on landscape types and feeding conditions. PhD thesis, Publication of Tallinn University of Technology, Tallinn, pp 121 23. Orru M, Lelgus M (2003) Peat resources investigation of Soosaare peatland in Viljandi County, the Geological Survey of Estonia, Tallinn, pp 33 24. Orru M, Orru H (2008) Sustainable use of Estonian peat reserves and environmental challenges 15th Meeting of the AssociationofEuropeanGeologicalSocieties location: Tallinn, Estonia Date: Sep 16–20. Estonian J Earth Sci 57(2):87–93. doi:10.3176/earth.2008.2.04 CrossRef 25. Orru M, Uebner M, Orru H (2011) Chemical properties of peat in three peatlands with balneological potential in Estonia. Estonian J Earth Sci 60(1):43–49. doi:10.3176/earth.2011.1.04 CrossRef 26. Parker I (1993) Mine pillar design in 1993: computers have become the opiate of the mining engineers. Mining engineering, 1993, July and August, 714–717 and 1047–1050 27. Pastarus JR (2005) Improved underground mining design method for Estonian oil shale deposit. 5th international scientific and practical conference on environment, technology and resources. Latvia, Rezekne, pp 270–274 28. Pastarus JR, Sabanov S (2005) Concept of risk assessment for Estonian oil shale mines. In: Proceedings of the 5th international conference “environment technology resources”, Rezekne Augstskolas Izdevnieciba, Rezekne, Latvia, June 16–18, 2005, 237–242 29. Pastarus JR, Toomik A (2001) Roof and pillar stability prognosis in Estonian oil shale mines. Rock Mechanics. In: Särkka P, Eloranta P (eds) Proceedings of the ISRM Regional Symposium EUROCK 2001 “Rock Mechanics a challenge for society”. A.A.Balkema/Lisse/Abingdon/Exton (PA)/Tokyo, Espoo, 849–853 30. Pastarus YR, Nikitin O (2003) Estimation methods for stability of mining excavations (on the example of shale oil deposit in Estonia). Gornyj Zhurnal Ruda i Metally 4–5:71– 75 (in Russian) 31. Peat Handbook 1982. Nedra, Moscow, 753 (in Russian) 32. Perens R (2005) Groundwater stand in 1999–2003. Geological Survey of Estonia, Tallinn (in Estonian) 33. Perens R, Vallner L (1997) Waterbearing formation. In: Teedumäe A, Raukas A (eds) Geology and mineral resources of Estonia. Estonian Academy Publishers, Tallinn, pp 163–177 34. Puura V, Vaher R (1997) Tectonics. In: Raukas A, Teedumäe A (eds) Geology and mineral resources of Estonia. Estonian Academy Publishers, Tallinn, pp 163–177 35. Reinsalu E (2001) Post technological processes in mined out areas. Estonian Science Foundation, Grant No. 3403, Tallinn (in Estonian) 36. Reinsalu E, Valgma I (2007) Oil shale resources for oil production. Oil Shale 24:9–14 37. Riet K (1974) About transmission capacity of Ordovician carbonate rock in the Estonia oil shale deposit. In: Proceeding of the academy of sciences ESSR. Chemistry. Geology 23, 3, 274–277 38. Regulation to room, pillars and safety zones calculation methods for underground oil shale mining (1997). Tallinn, pp 28 (in Estonian) 39. Sabanov S, Tohver T, Väli E, Nikitin O, Pastarus JR (2008) Geological aspects of risk management in oil shale mining. Oil Shale 25(2):145–152 CrossRef 40. Scott B, Ranjtih PG, Choi SK et al (2010) Geological and geotechnical aspects of underground coal mining methods within Australia. Environmental Earth Sciences 60(5):1007–1019. doi:10.1007/s1266500902396 CrossRef 41. Sokman K, Kattai V, Vaher R, Systra YJ (2008) Influence of tectonic dislocations on oil shale mining in the Estonia deposit. Oil Shale 25(2):175–187 CrossRef 42. Systra YJ, Sokman K, Kattai V, Vaher R (2007) Tectonic dislocations of the Estonian kukersite deposit and their influence on oil shale quality and quantity. In: 15th MAEGS meeting 16–20 Sep 2007, Tallinn, Estonia. Abstracts. pp 74–76 43. Taylor JR (1982) An introduction to error analysis. In: Commins ED (ed) The study of uncertainties in physical measurements. University Science Books, California, p 272 44. Tousignant ME, Pellerin S, Brisson J (2010) The relative impact of human disturbances on the vegetation of a large wetland complex. Wetlands 30(2):333–344. doi:10.1007/s1315701000199 CrossRef 45. Tutorial for digital mapping for Estonia geology (2008) Land Board (in Estonian) 46. Undusk V (1998) Safety factor of pillars. Oil Shale 15(2):157–164 47. Valgma I (2003) Estonian oil shale resources calculated by GIS method. Oil Shale 20(3):404–411 48. Valgma I (2009) Oil Shale miningrelated research in Estonia. Oil Shale 26(4):150–445 CrossRef 49. Valgma I, Kattel T (2005) Low depth mining in Estonian oil shale depositAbbau von Ölschiefer in Estland. In: Kolloquium Schacht, Strecke und Tunnel 2005: 14. und 15. April 2005, Freiberg/Sachsen: Kolloquium Schacht, Strecke und Tunnel 2005: 14 und 15. April 2005, Freiberg/Sachsen. Freiberg: TU Bergakademie, 213–223 50. Valgma I, Reinsalu E, Sabanov S, Karu V (2010) Quality control of oil shale production in Estonian mines. Oil Shale 27(3):239–249 CrossRef 51. Väli E, Valgma I, Reinsalu E (2008) Usage of Estonian oil shale. Oil Shale 25(2S):101– 114 CrossRef 52. Wu Q, Liu S (2011) The classification of mine environmental geology problems in China. Environ Earth Sci 64(6):1505–1511. doi:10.1007/s1266501005039 CrossRef About this Article Continue reading... To view the rest of this content please follow the download PDF link above. Over 8.5 million scientific documents at your fingertips © Springer International Publishing AG, Part of Springer Science+Business Media View publication stats
txt: See discussions, stats, and author profiles for this publication at: https://www.researchgate.net/publication/236005585 Possibilities of oil shale mining under the Selisoo mire of the Estonia oil shale deposit Article in Environmental Earth Sciences · December 2013 DOI: 10.1007/s12665-013-2396-x CITATIONS 17 READS 98 5 authors, including: Some of the authors of this publication are also working on these related projects: Rikastamine View project Vivika Väizene Tallinn University of Technology 91 PUBLICATIONS 250 CITATIONS SEE PROFILE Juri-Rivaldo Pastarus Tallinn University of Technology 36 PUBLICATIONS 61 CITATIONS SEE PROFILE Ylo also Ülo also in Russian Юло Joann Systr… Tallinn University of Technology 15 PUBLICATIONS 45 CITATIONS SEE PROFILE Ingo Valgma Tallinn University of Technology 404 PUBLICATIONS 1,503 CITATIONS SEE PROFILE All content following this page was uploaded by Ingo Valgma on 11 March 2015. The user has requested enhancement of the downloaded file. All in-text references underlined in blue are added to the original document and are linked to publications on ResearchGate, letting you access and read them immediately. Look Inside Get Access Find out how to access previewonly content Environmental Earth Sciences December 2013, Volume 70, Issue 7, pp 33113321 Date: 27 Mar 2013 Possibilities of oil shale mining under the Selisoo mire of the Estonia oil shale deposit Abstract The paper presents results of the study on oil shale mining (Estonia underground mine) possibilities under the Selisoo mire. The Selisoo area is 2,051 ha in extent, and most of the mire is in natural state. Peat layer consists of thick (4.4–6.5 m) oligotrophic peat. Mining under Selisoo will go at depths 65– 70 m under the surface. The mining field of the Estonia mine was planned between Ahtme and Viivikonna fault zones. The lowest hydraulic conductivity of carbonate rocks 0.11 l/day per m2 is found in the Oandu layer and for peat it is 0.35–0.0002 m/day. Therefore, together they form a good aquitard. When the annual rainfall amount is the highest, the difference between horizontal water inflow and runoff is positive with 127,000 m3 . Positive water balance is guaranteed in case of precipitation being at least 540 mm/year. The positive water balance is important for preserving the ecological system of Selisoo mire. For guaranteeing longterm stability of mine pillars, a new calculation method has been elaborated, based on the conventional calculation scheme, where the factor of safety is more than 2.3. Rheological processes are out of question, collapse of the pillars is impossible. Stability of the underground constructions and overburden rocks must be “eternal”. The criteria were elaborated for oil shale mining and will guarantee preservation of mires in natural or close to natural state. Article Metrics Citations 5 Social Shares References (52) 1. Botch MS, Masing VV (1979) Ecosystems of USSR. Nauka, Leningrad. [in Russian] 2. Fetter CW (1994) Applied hydrogeology, 3rd edn. Macmillan College Publishing Company, Inc, New York, Library of Congress CataloginginPublication Data, pp 1– 691 3. Hints L (1997) Aseri Stage Lasnamägi Stage Uhaku Stage Kukruse Stage Haljala Stage. In: Raukas A, Teedumäe A (eds) Geology and mineral resources of Estonia. Estonian Academy Publishers, Tallinn, pp 66–72 4. Hints L, Meidla T (1997) Keila Stage Oandu Stage Rakvere Stage Nabala Stage. In: Teedumäe A, Raukas A (eds) Geology and mineral resources of Estonia. Estonian Academy Publishers, Tallinn, pp 74–81 5. Huang S, Li X, Wang Y (2012) A new model of geoenvironmental impact assessment of mining: a multiplecriteria assessment method integrating FuzzyAHP with fuzzy synthetic ranking. Environ Earth Sci 66(1):275–284. doi:10.1007/s126650111237z CrossRef 6. Ivanov KE (1975) Water exchange in peatlands. Gidrometeoizdat, Leningrad, pp 86–91 [in Russian] 7. Joosten H, Clark D (2002) Wise use of mires and peatlands. International Mire Conservation Group, International Peat Society, Saarijärvi, p 303 8. Jõgar P (1983) Groundwater flow models of Pandivere Upland (northeast Estonia). In: Proceedings of academy of sciences of ESSR. Geology 32, 2, 69–78 [In Russian, summary in English] 9. Karu V, Västrik A, Anepaio A, Väizene V, Adamson A, Valgma I (2008) Future of oil shale mining technology in Estonia. Oil Shale 25(2S):125–134 CrossRef 10. Kattai V, Vingisaar P (1980) Structure of the Ahtme tectonic disturbance. In: Proceeding of the academy of sciences ESSR. Geology 29, 2, 55–62 [In Russian, summary in English abstract] 11. Ketcheson SJ, Price JS (2011) The impact of peatland restoration on the site hydrology of an abandoned blockcut bog. Wetlands 31(6):1263–1274. doi:10.1007/s13157011 02410 CrossRef 12. Kink H (1997) Karst and springs. In: Teedumäe A, Raukas A (eds) Geology and mineral resources of Estonia. Estonian Academy Publishers, Tallinn, pp 389–390 13. Koitmets K, Reinsalu E, Valgma I (2003) Precision of oil shale energy rating and oil shale resources. Oil Shale 20(1):15–24 14. Loopmann A (1996) Formation, development and perishing of mire massis. Development of mires and formation of bedpool complex. J Estonian Peat 3(4):18–21 [in Estonian, with English summary] 15. Lu W, Luo Y, Chen M et al (2012) An introduction to Chinese safety regulations for blasting vibration. Environ Earth Sci 67(7):1951–1959. doi:10.1007/s1266501216369 CrossRef 16. Mininglaw and legal regulation acts (1998) Ministry of Environment, Ministry of Economy. Part II, Tallinn, (in Estonian) 17. Nestor H, Soesoo A, Linna A, Hints O, Nõlvak J (2007) Ordovician in Estonia and southern Finland. MTÜ GEOGuide Baltoscandia, Tallinn, pp 1–32 18. Niinemets E, Pensa M, Charman D (2011) Analysis of fossil testate amoebae along the hummocklawnhollow gradient in Selisoo Bog, Estonia: local variability and implications for palaeoecological reconstructions in peatlands. Boreas 40:367–378 19. Orru H, Orru M (2006) Sources and distribution of trace elements in Estonian peat. Symposium on peatlands—basin evolution and depository of records on global environmental and climatic changes location: Florence, Italy. Glob Planet Change 53(4):249–258. doi:10.1016/j.gloplacha.2006.03.007 CrossRef 20. Orru M (1975) Report of explorationinvestigation works of peat deposits in KohtlaJärve County. Manuscript at depository of manuscript reports of geological survey of Estonia. Geological survey of Estonia, Tallinn (in Estonian, with Russian summary) 21. Orru M (1995) Estonian mires. Geological Survey of Estonia, Tallinn (in Estonian, with English summary) 22. Orru M (2010) Dependence of Estonian Peat deposit properties on landscape types and feeding conditions. PhD thesis, Publication of Tallinn University of Technology, Tallinn, pp 121 23. Orru M, Lelgus M (2003) Peat resources investigation of Soosaare peatland in Viljandi County, the Geological Survey of Estonia, Tallinn, pp 33 24. Orru M, Orru H (2008) Sustainable use of Estonian peat reserves and environmental challenges 15th Meeting of the AssociationofEuropeanGeologicalSocieties location: Tallinn, Estonia Date: Sep 16–20. Estonian J Earth Sci 57(2):87–93. doi:10.3176/earth.2008.2.04 CrossRef 25. Orru M, Uebner M, Orru H (2011) Chemical properties of peat in three peatlands with balneological potential in Estonia. Estonian J Earth Sci 60(1):43–49. doi:10.3176/earth.2011.1.04 CrossRef 26. Parker I (1993) Mine pillar design in 1993: computers have become the opiate of the mining engineers. Mining engineering, 1993, July and August, 714–717 and 1047–1050 27. Pastarus JR (2005) Improved underground mining design method for Estonian oil shale deposit. 5th international scientific and practical conference on environment, technology and resources. Latvia, Rezekne, pp 270–274 28. Pastarus JR, Sabanov S (2005) Concept of risk assessment for Estonian oil shale mines. In: Proceedings of the 5th international conference “environment technology resources”, Rezekne Augstskolas Izdevnieciba, Rezekne, Latvia, June 16–18, 2005, 237–242 29. Pastarus JR, Toomik A (2001) Roof and pillar stability prognosis in Estonian oil shale mines. Rock Mechanics. In: Särkka P, Eloranta P (eds) Proceedings of the ISRM Regional Symposium EUROCK 2001 “Rock Mechanics a challenge for society”. A.A.Balkema/Lisse/Abingdon/Exton (PA)/Tokyo, Espoo, 849–853 30. Pastarus YR, Nikitin O (2003) Estimation methods for stability of mining excavations (on the example of shale oil deposit in Estonia). Gornyj Zhurnal Ruda i Metally 4–5:71– 75 (in Russian) 31. Peat Handbook 1982. Nedra, Moscow, 753 (in Russian) 32. Perens R (2005) Groundwater stand in 1999–2003. Geological Survey of Estonia, Tallinn (in Estonian) 33. Perens R, Vallner L (1997) Waterbearing formation. In: Teedumäe A, Raukas A (eds) Geology and mineral resources of Estonia. Estonian Academy Publishers, Tallinn, pp 163–177 34. Puura V, Vaher R (1997) Tectonics. In: Raukas A, Teedumäe A (eds) Geology and mineral resources of Estonia. Estonian Academy Publishers, Tallinn, pp 163–177 35. Reinsalu E (2001) Post technological processes in mined out areas. Estonian Science Foundation, Grant No. 3403, Tallinn (in Estonian) 36. Reinsalu E, Valgma I (2007) Oil shale resources for oil production. Oil Shale 24:9–14 37. Riet K (1974) About transmission capacity of Ordovician carbonate rock in the Estonia oil shale deposit. In: Proceeding of the academy of sciences ESSR. Chemistry. Geology 23, 3, 274–277 38. Regulation to room, pillars and safety zones calculation methods for underground oil shale mining (1997). Tallinn, pp 28 (in Estonian) 39. Sabanov S, Tohver T, Väli E, Nikitin O, Pastarus JR (2008) Geological aspects of risk management in oil shale mining. Oil Shale 25(2):145–152 CrossRef 40. Scott B, Ranjtih PG, Choi SK et al (2010) Geological and geotechnical aspects of underground coal mining methods within Australia. Environmental Earth Sciences 60(5):1007–1019. doi:10.1007/s1266500902396 CrossRef 41. Sokman K, Kattai V, Vaher R, Systra YJ (2008) Influence of tectonic dislocations on oil shale mining in the Estonia deposit. Oil Shale 25(2):175–187 CrossRef 42. Systra YJ, Sokman K, Kattai V, Vaher R (2007) Tectonic dislocations of the Estonian kukersite deposit and their influence on oil shale quality and quantity. In: 15th MAEGS meeting 16–20 Sep 2007, Tallinn, Estonia. Abstracts. pp 74–76 43. Taylor JR (1982) An introduction to error analysis. In: Commins ED (ed) The study of uncertainties in physical measurements. University Science Books, California, p 272 44. Tousignant ME, Pellerin S, Brisson J (2010) The relative impact of human disturbances on the vegetation of a large wetland complex. Wetlands 30(2):333–344. doi:10.1007/s1315701000199 CrossRef 45. Tutorial for digital mapping for Estonia geology (2008) Land Board (in Estonian) 46. Undusk V (1998) Safety factor of pillars. Oil Shale 15(2):157–164 47. Valgma I (2003) Estonian oil shale resources calculated by GIS method. Oil Shale 20(3):404–411 48. Valgma I (2009) Oil Shale miningrelated research in Estonia. Oil Shale 26(4):150–445 CrossRef 49. Valgma I, Kattel T (2005) Low depth mining in Estonian oil shale depositAbbau von Ölschiefer in Estland. In: Kolloquium Schacht, Strecke und Tunnel 2005: 14. und 15. April 2005, Freiberg/Sachsen: Kolloquium Schacht, Strecke und Tunnel 2005: 14 und 15. April 2005, Freiberg/Sachsen. Freiberg: TU Bergakademie, 213–223 50. Valgma I, Reinsalu E, Sabanov S, Karu V (2010) Quality control of oil shale production in Estonian mines. Oil Shale 27(3):239–249 CrossRef 51. Väli E, Valgma I, Reinsalu E (2008) Usage of Estonian oil shale. Oil Shale 25(2S):101– 114 CrossRef 52. Wu Q, Liu S (2011) The classification of mine environmental geology problems in China. Environ Earth Sci 64(6):1505–1511. doi:10.1007/s1266501005039 CrossRef About this Article Continue reading... To view the rest of this content please follow the download PDF link above. Over 8.5 million scientific documents at your fingertips © Springer International Publishing AG, Part of Springer Science+Business Media View publication stats

Analysis of water removal parameters in mining sites
Paper: Analysis of water removal parameters in mining sites

The future of oil shale mining
Paper: The future of oil shale mining related to the mining and hydrogeological conditions in the Estonian deposit


Mine water and dewatering of mining
Mine water and dewatering of oil shale, limestone and phosphate rock mining in Estonia

Water Quality in Maardu Phosphate Rock Mining Area in Estonia
Paper: Water Quality in Maardu Phosphate Rock Mining Area in Estonia
Papers
Nature and water related publications
Paper:

Water Quality in Maardu Phosphate Rock Mining Area in Estonia
The impact of infiltration dam on the groundwater regime in the Kurtna landscape reserve area
Influence of water discharging on water balance and quality in the Toolse river in Ubja oil shale mining region
Potential of underground minewater in Estonian oil shale mining region
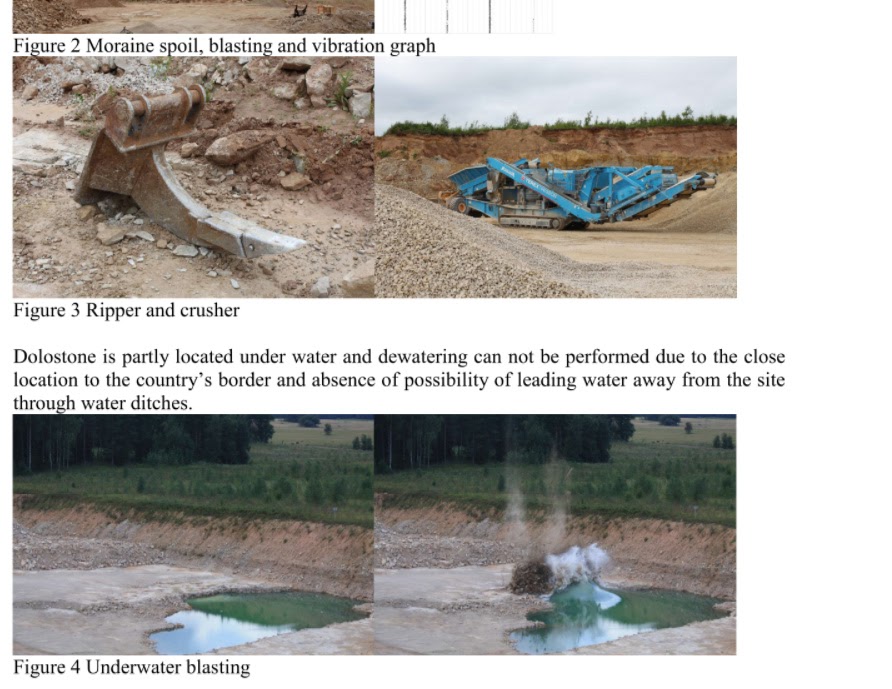
Underwater blasting experiments in Estonia
Mining influence to the water regime in Kunda region

Geotechnical Processes and Soil-Water Movement with Transport of Pollutants in the Estonian Oil Shale Mining Area
The future of oil shale mining related to the mining and hydrogeological conditions in the Estonian deposit
Paper:
- An evaluation of technological overburden thickness
- Analysis of water removal parameters in mining sites
- Computational groundwater monitoring and management system
- Detection of Mine Collapses with Seismic Methods
- Digitizing Mining Plans
- Environmental impact of mining
- Explosives Handling
- Geotechnical Processes and Soil-Water Movement with Transport of Pollutants
- Influence of water discharging
- Interpolation Techniques For Reserve Calculations
- Mine water and dewatering
- Mine water as a potential source of energy
- Mining Conditions for the Cement Industry
- Mining influence on the environment
- Mining influence on the water regime
- Oil Shale reserve calculations
- Papers
- Possibilities of mining under the mire
- Potential of underground minewater
- Scholar
- Sustainable phosphate rock mining
- Technogenic water in closed mines
- The future of oil shale mining
- The impact of infiltration dam
- The origin and amounts of removal water
- Underwater blasting experiments
- Usage of underground minewater
- Water Quality in Maardu Phosphate Rock Mining Area

Water Quality in Maardu Phosphate Rock Mining Area in Estonia

The impact of infiltration dam on the groundwater regime in the Kurtna landscape reserve area
Influence of water discharging on water balance and quality in the Toolse river in Ubja oil shale mining region
Potential of underground minewater in Estonian oil shale mining region
Underwater blasting experiments in Estonia
Mining influence to the water regime in Kunda region

Geotechnical Processes and Soil-Water Movement with Transport of Pollutants in the Estonian Oil Shale Mining Area
The future of oil shale mining related to the mining and hydrogeological conditions in the Estonian deposit
Paper: Technologies for Decreasing Mining Losses
txt: Environmental and Climate Technologies
_________________________________________________________________________________________________2013 / 11
41
doi: 10.2478/rtuect-2013-0006
Technologies for Decreasing Mining Losses
Ingo Valgma
, Vivika Väizene1
, Margit Kolats1
Tallinn University of Technology
Abstract - In case of stratified deposits like oil shale deposit in
Estonia, mining losses depend on mining technologies. Current
research focuses on extraction and separation possibilities of
mineral resources. Selective mining, selective crushing and
separation tests have been performed, showing possibilities of
decreasing mining losses. Rock crushing and screening process
simulations were used for optimizing rock fractions. In addition
mine backfilling, fine separation, and optimized drilling and
blasting have been analyzed. All tested methods show potential
and depend on mineral usage. Usage in addition depends on the
utilization technology. The questions like stability of the material
flow and influences of the quality fluctuations to the final yield
are raised.
Keywords – oil shale, losses, mining, extraction.
I. INTRODUCTION
In case of stratified deposits like oil shale deposit in
Estonia, mining losses depend on mining technologies.
Stratified deposits are being developed from lower bedding
depth to deeper and more complicated conditions [23].
Continuously the environmental or social restrictions require
increasing coefficients that increase mineral losses [20]. This
could be limited with the help of technological development
[34,13, 36]. During the period starting from 1916 many
technologies have been used and tested [31]. Currently the
market economy is the main driving force for choosing
technologies. This causes short term choices and works
against sustainability.
Current research focuses on extraction and separation
possibilities of oil shale. Selective mining, selective crushing
and separation tests have been performed, showing
possibilities of decreasing mining losses. Rock crushing and
screening process simulations were used for optimizing
fractions. In addition mine backfilling, fine separation of oil
shale, and optimized drilling and blasting have been analyzed.
All tested methods show potential and depend on mineral
usage [37]. Usage also depends on the utilization technology.
Questions like stability of the material flow and influences of
the quality fluctuations to the final yield are raised. Tonnage,
calorific value and size distribution of the product form the
quality indicators [43]. Avoiding losses in any of these
processes decreases mining losses and has a positive effect on
resource usage and sustainability. In addition, decreasing
losses increases the amount of resource and sustainability of
energy supply for the country [30, 32]. If optimized
technology allows maintaining required productivity, it could
be applied, even if fitting into the existing technological
structure is taking longer than technically available [33, 35, 8].
The aim of the current study is to clarify what technical
solutions could be applied for decreasing oil shale mining
related losses.
II.ANALYSES AND TESTS
A. Selective mining
Selective extraction of oil shale seam was analyzed to
understand following methods:
1. Cutting with bulldozer and excavator rippers
2. Cutting with surface miners
3. Cutting with longwall miners
4. Cutting with shortwall miners.
a) Cutting with rippers
Selective extraction of the oil shale seam can be done by a
bulldozer ripper or hydraulic excavator ripper. Ripping is a
low-selective technology [42]. In deeper surface mining areas,
100 tonnes class bulldozers were used and in more weathered
areas or partial ripping zones, the 60 tonne class was used.
One disadvantage of bulldozer ripping is excessive crushing of
oil shale by heavy bulldozers with crawlers [18].
b) Cutting with surface miners
Tests with surface miners Vermeer T1255 and Wirtgen
2500 SM were carried out. The tests were followed after
longer period tests with smaller class surface miners during
the last 25 years. Tests have been performed with different oil
shale and limestone layers. Surface miners are considered as
BAT (Best Available Technology) for surface oil shale mining
extraction [12, 42, 18, 15, 5].
c) Cutting with longwall miners
The planning and testing has been done for longwall mining
possibilities. Shearers were used and tested for 30 years in five
oil shale mines in Estonia [1]. Longwall technology has also
been chosen as one of the alternatives for phosphate rock
mining [41]. Technologically, this technological solution has
improved compared with initial possibilities. Since the
hydraulic support system was limiting the height of the
longwall face (1,5 m) and the power of the shearers was
relatively low (210 kW) the losses have been 50% in longwall
section. Today’s sharers utilize power in the range of 2200
kW, which is 10 times higher than in the tested units. Since
the productivity (equal to income) could be increased,
longwall technology is one of the possibilities for lowering
losses. In case of removing protective side pillars between
longwall section, rough estimation shows, that losses could be
lowered down to 5% taking into account the geological
dislocations and disfollowing the exact horizontal plane of the
oil shale seam. The main obstacle of longwall shearing
Brought to you by | Tallinn Technical
Authenticated | 193.40.249.178
Download Date | 10/17/13 10:07 AM
Environmental and Climate Technologies
2013 / 11_________________________________________________________________________________________________
42
technology is solving environmental and social questions,
regarding subsiding the ground and accepting certain areas
where such subsiding could be allowed. In comparison to the
surface mining stripping in the open cast mining areas,
longwall mining could be considered as a technology which
causes less impact to the landscape. The ground would be
lowered by up to 70% of the created space. That makes 2
meters. In open casts, even the fluctuations in the leveled
overburden spoil could be 5 meters. In trench or ditches areas,
the level fluctuations are up to 40 meters. This makes longwall
mining the most sustainable mining method for oil shale.
d) Cutting with shortwall miners
Evaluations of breakability have been made with
roadheaders F2 and 4PP-3. As a recommendation, a doubledrum
road header was proposed. Currently the power of the
machines has increased and pick properties allow cutting
harder rock. It is proposed, that both longitudinal or transverse
head continuous miners (roadheaders) could be used for
cutting oil shale [12]. The selectivity option is directly related
to the waste material handling and should be tested in the mine
[11].
Shortwall miner utilization could be the solution for making
development entrances, drifts and rooms for mining. In case of
satisfactory cutting performance, it could be used for
extracting oil shale in production sections as well. The tests
have shown, that shortwall mining is a promising technology
and requires, as with longwall mining, surface miner mining
and axle bucket crushing changes in some operations and
processes in mining technology. Shortwall mining requires
fast roof supporting technology. The supporting could be in
addition in some extent easer because of lower possible
fragmentation of rock caused by absence of blasting in the
mine.
B. Selective crushing
For selective crushing, the following methods were tested:
1. crushing in a drum (Bradford drum) with help of rock
falling impact and hammer crusher inside the drum;
2. impact crusher in underground sections as first stage
crusher or impact crusher for aggregate production
from oil shale waste rock;
3. axle crusher buckets with cutting and skimming
process.
An impact crusher has been used in underground sections as
a first stage crusher and for aggregate production from oil
shale waste rock that is limestone [27].
The purpose of underground crushing is to reduce ROM
(run of mine) size to the required size of up to 300 mm for
transporting it on belt conveyors to the surface.
C. Separation
Separation tests have been performed by jigging and
cycloning. The purpose was to find out the percentage of the
fine material that could be separated. Jigging tests have shown
relatively good results allowing separating initially mixed
material into five different fractions. The calorific value of
best fraction is highest and the limestone fraction in opposition
should be considered as the ready selected material for
limestone aggregate. Up to now the main focus has been
mechanical experimenting with jig. The main obstacle of the
technology could be achieving required productivity. It is
similar to the filter press technology where the productivity of
the single unit could be low. On the other hand, if the
production line could be completed with different stages, the
required productivity could also be to some extent lower. To
decrease required machine productivity for the same output,
drum crushing or axle crushing could be used prior to the
jigging.
Cycloning has shown that the calorific value of cycloned
and non- cycloned fine material has no remarkable difference.
Since cycloning could be done on many variations, the initial
test could be considered as failed because of short time and no
variations. These tests should be continued, preferably with
apilot unit or laboratory units at first.
D. Rock crushing
For crushing, the following options have been analysed:
1. Crushing with sizers
2. Crushing with impact crushers
3. Crushing with double drum crushers
4. Crushing with drum crusher
5. Crushing with jaw crusher.
Crushing process simulations were used to evaluate the
distribution curves of the final product. The necessary data for
this purpose is bulk density of material and the maximum size
of the particles going for crushing. In order to get optimal
results on certain cases, crushing units, crushers and mobile
crushers can be added to the scheme. This gives extra value in
lowering engineering costs, on experimenting with different
devices and on further changes [19, 45].
As an example, material data for thesimulation program has
been:
Input material < 1000 mm
Solid density 1,84 t/m3
Crushability 85% - which is the maximum
Productivity 1000 t/h
Gravel 31% - does not influence the results (Fig. 1.).
The value of abrasiveness has been between 0,1…1500 g/t,
calculations show that this does not affect the simulation
results. Neither does moisture. The crusher output cavity is set
on 180mm which means that the maximum size of the
outcoming particle is 200mm.
The workload of the impactor crusher is 97% of the
maximum capacity. After crushing, the feed moves to the
roller screen, where the feed flows into three classes:
0…25 mm 22,8%
12…107 mm 55,2% - which include 11% 12…25
mm (Fig.2.)
107…200 mm 22% .
It can be detected that the fines part is 28,9%.
Brought to you by | Tallinn Technical
Authenticated | 193.40.249.178
Download Date | 10/17/13 10:07 AM
Environmental and Climate Technologies
_________________________________________________________________________________________________2013 / 11
43
Fig. 1. Material data insertion window
Fig. 2. Flow data
Fines are added on the secondary crushing/particle size is
107...200 mm. Calculations have shown that in this way 5% of
fines are added. At the present moment the best crushing
option in making the minimum fines is crushing with the sizer.
Experiments show that the minimum in generating fines is
achieved when the rotating speed of sizer was 175 rpm. In
slow rotation the generation was 11,8% and fast rotation gave
6,5% of fines (Fig.3).
As experiments show, it is possible to decrease the fines
generation which mostly is considered to be waste.
Each simulation manufacturer focuses on separation
methods or some part in the separation process. When it
comes to crushers, then simulations are also manufacturer
based and reflect types and models, what the company offers
[7, 4]. Newer products are introduced in the simulation
programmes later. In case of the roll crusher for example, the
characteristics and behaviours are still added to the
programme. Sizers are even more complex, because they have
been used only a few years and therefore are relatively new
products among crushers. In Estonia there are a lot of
questions concerning the fines in the crushing process.
Fig. 1. Experiments resulted in fines generation of 2,2% [10]
E. screening
Two basic screening solutions have been analysed in
addition to the traditional vibration screening:
1. Screening in drum screen
2. Screening on rotary screen
3. Screening on roller screen.
F. Mine backfilling
The tests contained testing of mixes properties of the
backfill material, testing of backfilling technology and
analyzing backfilling material flows. The main hypotheses are
that backfilling reduces mining losses and the amount of waste
on the ground surface [27]. In addition it increases land
stability [12]. Stability issues have been developed in sense of
information availability. Mapping, special information
systems and seismological methods allow one to detect any
collapses which have occured [21, 25].
G. Fine separation
Fine separation tests were carried out with CDE equipment
and with jigging equipment. The aim of the fine separation test
is to separate fines from pulp before they reach sedimentation
pond and to take it into use as a product.
III. RESULTS AND DISCUSSION
A. Selective mining
a) Cutting with rippers
In Ubja oil shale open cast, the productivity of oil shale
hydraulic ripping was nearly 600 m3/h. At the Ubja open cast,
overall oil shale losses are 0% based on the Environmental
Register. Bulldozer ripping is considered as semi-selective
ripping where seam losses make 12% in comparison to 5%
with surface miners [42]. The first problem of ripping
technology has been power of ripping machines. Before 100
tonnes class bulldozers were applied, the low ripping power
was one of the main concerns. Excavator ripping is in similar
stage like bulldozer ripping has been in its beginning stage.
The power of the excavator ripper is not satisfactory to reach
required productivity. Excavator ripping does not solve the
losses question because of the principle of vertical movement.
Brought to you by | Tallinn Technical
Authenticated | 193.40.249.178
Download Date | 10/17/13 10:07 AM
Environmental and Climate Technologies
2013 / 11_________________________________________________________________________________________________
44
Excavator ripping could be considered in low bedding areas,
where drilling and blasting is prohibited, the oil shale seam is
weathered meaning weaker bonds between layers. A bulldozer
ripper, therefore could be used as low selective miner, but it is
limited by availability of keeping losses down. The main
problem is limestone and oil shale pieces and lumps that
contain both material and could not be separated by the ripper.
If needed, one of the solutions could be skimming with axle
crushers.
b) Cutting with surface miners
It was found that extracting with a high selective surface
miner is the main possibility of decreasing losses in case of
surface mining. The main obstacle for using such technology
is the partly unsolved overburden stripping technology. In the
future, combined methods should be considered like high
selective cutting plus selective axle crushing for aggregate
separation.
Mining with surface miner Wirtgen 2500 SM helps to
reduce losses and improve calorific value of oil shale. It is
possible to mine limestone and oil shale seams separately with
higher accuracy than rippers (2-7 cm) with deviations about
one centimetre [42]. Losses can be decreased from 12 percent
to 5 percent compared to ripping [18]. Based on practical data,
the surface miner enables to increase the output of oil shale up
to 1 tonne per square meter. The oil yield increases 30%,
reaching up to 1 barrel per tonne of oil shale during the oil
shale retorting, because of better quality, meaning higher
calorific value of the material that is sent to the retorts [42].
c) Cutting with longwall miners
It was found that distribution of required large particles of
oil shale is possible with longwall shearers.
The practice with longwall shearers shows that the subject
for cutting is oil shale and the larger size is distributed to the
limestone fraction [1]. This is due to the hardness difference of
the rocks. Longwall mining could decrease horizontal losses
by 20 to 40%.
d) Cutting with shortwall miners
One of the main advantages that a shortwall miner could
present are the possibility of avoiding weakening pillars in the
mine by blasting [20].
This in addition could give the possibility to decrease pillar
size and to decrease losses left to the pillars. Pillar losses that
are caused by pillars with cross section area of 16 to 49 square
meters could be decreased therefore by 16 to 28% with
avoidance of the 0,3 zone by sides of the pillars.
The pillas strength and stability of the ground are directly
related but have the opposite influence on sustainability. In
case of backfilling this dilemma could be solved [22]. In some
areas also smooth and directed subsidence could be solution.
B. Selective crushing
The underground crushing process where ROM (run of
mine) size is reduced to the required size up to 300 mm has no
direct influence on the percentage of losses. Nevertheless,
ROM size distribution is influenced by impact crushing and
fines are produced. In case of oil production with vertical
generators, fines and small classes of oil shale are considered
as waste, if no other uses are found, like cement, electricity or
oil production with SHC technology.
Selective crushing is important both for cleaning and sizing
oil shale and cleaning and sizing limestone. Therefore
selective crushing or selective mining methods are
recommended [27].
C. Rock crushing
a) Crushing with sizers
One of the options could be using slow rotating or
optimized rotating sizer for oil shale ROM crushing.
According to the recommendations of crusher producers, all
crusher types are suitable for crushing oil shale [25]. In
relation to the moisture content, jaw crusher and gyratory
crushers are unsuitable, requiring relatively dry material
(
Influence of water discharging on water balance and quality in the Toolse river in Ubja oil shale mining region
Paper: Influence of water discharging on water balance and quality in the Toolse river in Ubja oil shale mining region

Oil Shale mining-related research in Estonia
txt: Oil Shale, 2009, Vol. 26, No. 4, pp. 445–450 ISSN 0208-189X
doi: 10.3176/oil.2009.4.01 © 2009 Estonian Academy Publishers
EDITOR’S PAGE
OIL SHALE MINING-RELATED RESEARCH
IN ESTONIA
Finally the long-announced changes
arrived, caused by environmental, geological
and technological changes in oil
shale mining sector. In addition, the
biggest change has occurred with
alteration of professionals’ generation.
In most of the countries, the institutions
dealing with mining are facing difficult
questions – to continue or not to
continue, and if, then how. Research,
development and teaching work are
facing a low at the moment.
The biggest section in oil shale business
in which saving and effectiveness
could be achieved is the mining sector.
It includes social and environmental
restrictions in deposits, losses in pillars and separation of products and waste
rock. Losses are closely related to backfilling and waste rock usage. Much
smaller sections include production of oil, electricity and chemicals in which
most of the research and development is performed today.
Efficiency of oil shale usage depends manly on mining technology.
446 Editor’s Page
Current urgent topics for investigating, testing and developing of oil shale
mining related questions are backfilling, mechanical extracting of shale and
digital modelling of mining processes.
Estonian oil shale mining industry with its 90 years of history has been a
test polygon for equipment manufacturers, geologists and mining engineers
from Germany, Soviet Union, Finland and Sweden.
These are the reasons why Estonia has recently hosted in average one
international mining-related conference per year and is going to host the
most important and highest level of the conferences – Annual General
Meeting of the Society of Mining Professors “Innovation in Mining” (SOMP
AGM 2010, http://mi.ttu.ee/somp2010).
Mining research concerning Estonian oil shale deposits
Several mining-related factors, such as changes in environment, underground
conditions, landscape and property, tend to awoke public resistance.
In order to create sustainable mining conditions, research on the natural
environment and experiments conducted in mines and mined areas are
required. Together with physical experiments, computer modelling is a widespread
method in mining engineering. The principal task of modelling is to
choose criteria and constraints satisfying all involved parties, as well as ways
of presenting. In reaction to this, various restrictions for mining (mainly
environmental ones) are created. In most cases, their argumentation is onesided,
often subjective. As a result, it is not possible to exploit a large part of
deposits due to environmental restrictions, but also due to expiration of evaluation
criteria of the supplies of resources. Part of the problems is caused by
miners that do not apply environmentally friendly mining technologies.
Mining environment is understood as the entity including resources
(deposits and groundwater), land (agricultural and housing land), engineering
and technology. Research has shown that ground and landscapes
changed by mining can afterwards be of better quality than before. If
reclaiming is planned skilfully, the soil, landforms, forest, water bodies and
agricultural land can be more valuable than before mining. All this is the
basis for developing acceptable, environmentally friendly mining.
Acceptable mining requires engineering research concerning both natural
and technogenic environment, e.g. modelling and pilot projects. As such
research is voluminous, computer modelling has become the principal tool in
solving problems related to all sorts of developments, technologies and
effects. The key issue is defining criteria and restrictions that satisfy all the
involved parties. Creating models and estimation criteria requires miningrelated
expertise and a database acquired from measurements, experimenting
and laboratory testing. Modelling is followed by laboratory and industrial
experiments, which require profound know-how. The experiments include
e.g. chronometry of technological productivity, geometric and geological
measurements, and measurements of rock quality. The parties that compose
mining plans, development plans and estimations of environmental effects
Editor’s Page 447
have acquired planning and modelling software for various purposes, which
causes some problems: the geological database requires skilful treatment;
data exist in several geodetic coordinate systems and include partly obsolete
stratigraphic terminology. Unfitting coordinate systems disturb the usage of
cross-use of spatial data in various geoinformation databases (digital maps,
border files, land registers, building registers, databases of technological
networks of enterprises, etc.). This creates further problems related to mined
areas. Most environmental restrictions, which have to be taken into account
in mining and building, are not based on real measurements. Usually the
restrictions are two-dimensional and do not take into account the structures
of the geological environment. Such vagueness does not support precise
engineering calculations or modelling. Basic modelling systems that are
designed in developed mining countries are principally meant for deep
deposits. However, in Estonia there are blanket deposits, which cause wider
environmental effect of mining. Because of that, imported systems have to
be adapted.
Mining is possible in any circumstances, provided that sustainable mining
environment has been created. In other words, with the proper choice of
mining technology, the effect of mining has been damped below the level
that the nature and man can tolerate. The methodology and criteria for
planning, designing, modelling and accepting of sustainable mining environment
will provide the basis for mineral raw material that the economy
requires, both in the near and far future.
The principal direction of developing mining technology is filling the
mined area. This provides control over majority of environmental effects.
For instance, filling the workings decreases the loss of resources and land
subsidence, and at the same time provides usage for stockpiling. Filling the
berms of surface mine decreases dewatering; harmless waste can be used for
filling open mines and in this manner offer new building land.
Local land subsidence related to mining may extend also to technological
networks. It is possible to find out deformation parameters by geodetic
monitoring. Taking these parameters into account enables to model further
the extent and effect of the deformation.
Modelling, including digital planning, is aimed at gaining and creating the
following: mining indicators needed for making decisions, future scenarios of
mining oil shale and building material, support for development planning at
state and regional level, technological solutions that take into account all
possible environmental effects and social reactions, new output: project solutions,
theme maps, inquiries, zoning, evaluations of crises or risks, optimal
methodology for gaining, storing and using information, having in mine
requirements for various purposes and levels, more effective usage of geological,
technological and spatial information, additional functionality of the
database.
The optimal solution is obtained by modelling. The most general but also
dominant criteria are: minimal effect on man and nature, minimal amount of
448 Editor’s Page
residual and waste, maximal economic profit, also in other fields not only in
the mining industry. The problem includes several criteria, and its solving
requires both theoretical and computational solutions. Principal methods are
related to introducing sensors, measuring equipment and mining condition
experiment, matching structures of various data and modelling based on
them. The methods are: mapping the modelling criteria, indicators and processes
of the mined areas; experimenting the possibilities of application,
compatibility and results of mining software; applying laboratory experiments
and fieldwork in modelling; creating models for blanket deposits
(methodology in modelling MGIS, i.e. mining geoinformation system,
models of new mines, changes in ground conditions, environment (modelling
and analysis of groundwater dynamics, effects of dust, noise, etc.),
geotechnological models in mined areas); applying seismological methods
for developing theory for collapse risk, analysis methods for creating spatial
models from geodetic spatial information, studies on material properties
for developing theory for criteria for rock breakage, dendrochronologic
studies for monitoring changes caused by collapses and changes in the water
regime.
As a result, conditions for creating mining environment satisfying all
involved parties (industry, state, public, decision makers) will be developed,
applicable for any deposit of any resource. A system of criteria of evaluating
the mining environment will be designed.
This research provides for mining science a new level of digital modelling
of blanket deposits, basing on long-term experiments and modern digital
planning. The research results will be applied in compilation of the state
development plan, planning mined areas, as well as in teaching and science.
The results are relevant principally for users of land and ground (builders,
geologists, hydrogeologists, hydrologists, mining engineers and reclaimers).
The results provide better understanding between the public and the
miners, and further a basis for well-argumented communication and promotion
for economy in the manner that satisfies both parties. In recent years,
there has been a world-wide initiative for research, creating the concept of
sustainable mining, using relevant indicators and making decisions based on
them. MMSD (Mining, Minerals, and Sustainable Development), SDIMI
(Sustainable Development Indicators for the Minerals Industry) and other
international networks emphasize the need for creation of a concept for
regional sustainable mining, relevant for local conditions. At the same time,
modelling systems are being built and usage of non-traditional fuels is being
started.
About three decades ago oil-shale mines of the former USSR including
Estonia did not use the progressive mining methods with continuous miner,
which are most suitable for the case of high-strength limestone layers in oilshale
bed. Therefore, oil shale mining with blasting has been used as a basic
mining method in Estonian minefields up to now while continuous miner
was tested for roadway driving only. As for cutting, the installed power of
Editor’s Page 449
coal shearers and continuous miners has increased enormously since the
original work. The actual state of the market has changed, and a wide range
of powerful mining equipment from well-known manufacturers like
DOSCO, EIMCO, EICKHOFF, etc. is available now. Estonia has 30 years
of experience in cutting with longwall shearers which were not capable of
cutting hardest limestone layer inside of the seam. Tests with road headers
have been carried out in the 1970s. Additionally Wirtgen surface miners
have been tested (SM2100 and SM2600) for two years as well as SM2200
and Man Tackraf surface miner, and currently the testing of Wirtgen surface
miner SM2500 for high selective mining in an open cast mine is being
performed.
The main field to be developed in addition to mine backfilling is
mechanical extraction of oil shale. Potentially this allows increasing oil
yield, decreasing CO2 pollution, decreasing ash amount, decreasing oil shale
losses, avoiding vibration caused by blasting, avoiding ground surface
subsidence (in the case of longwall mining), increasing drifting and extracting
productivity compared with current room and pillar mining, increasing
safety of mining operations. The final aim of the research is to use BAT
(best available technology) for underground mining in areas with arduous
conditions of coal and oil-shale deposits. The main problems to be solved
are: selective cutting of oil shale (15 MPa) and hard limestone (up to
100 MPa), roof support at the face, stability of the main roof, roof bolting,
pillar parameters, backfilling with rock or residues (ash) from oil production,
water stopping and pumping in problematic environment (30 m3
/t expected).
Currently room and pillar mining with drill and blast technology is used
underground. Supporting is done with bolts. Mining production is in total
around 14 Mt/y, including 7 Mt/y underground. Total raw material amount
underground is 12 Mt/y. Tests are made for opening new mines, with total
production 15 Mt/y.
Continuous miners keep playing a major role in the underground industry
in over fourteen countries worldwide. Estonia’s oil-shale industry is at the
beginning of introducing modern fully mechanized continuous miner
systems, which could increase productivity and safety in the underground
mines.
A longitudinal cutting head-type miner was first introduced in the former
Soviet Union by modifying the Hungarian F2 roadheaders and in the 1970s
in Estonia by modifying the Russian coal roadheader 4PP-3. Evaluation of
breakability was performed by a method developed by A. A. Skotchinsky
Institute of Mining Engineering (St Petersburg, Russia). For this purpose
over a hundred samples produced by cutting of oil shale and limestone, as
well as taken in mines by mechanical cutting of oil shale were analysed.
Evaluations were made for using coal-mining equipment for mining oil
shale. Comparative evaluations were made by the experimental cutting of oil
shale in both directions – along and across the bedding, including also
mining-scale experiments with cutting heads rotating round horizontal
450 Editor’s Page
(transverse heads) and vertical axes (longitudinal heads). In both cases the
efficiency was estimated by power requirement for cutting. The feasibility
was shown by breaking oil shale in direction of cutting across the bedding by
using cutting drums on horizontal axis of rotation. The research also
evidenced that the existing coal shearers proved low endurance for mining
oil shale. Therefore, there arose the problem of developing special types of
shearers for mining oil shale or modifying the existing coal shearers.
It was further stated that the better pick penetration of the longitudinal
machines allows excavation of harder strata at higher rates with lower pick
consumption for an equivalent-sized transverse machine. It was reported that
with the longitudinal cutting heads the dust forming per unit of time
decreases due to smaller peripheral speed. The change in the magnitude of
the resultant boom force reaction during a transition from arcing to lifting is
relatively high for the transverse heads, depending on cutting head design.
Specific energy for cutting across the bedding with longitudinal heads is
1.3–1.35 times lower which practically corresponds to the change of the
factor of stratification.
These are the questions waiting for answers in the near future for
effective oil shale extraction in Estonia and in similar mining conditions. In
spite of current economic problems, still everything begins with mining.
Ingo VALGMA
Head of Department of Mining of Tallinn University of Technology,
Head of Estonian Mining Society,
President of the Society of Mining Professors / Societät der Bergbaukunde
Developing computational groundwater monitoring and management system
Paper: Developing computational groundwater monitoring and management system for Estonian oil shale deposit

Paper: The impact of infiltration dam on the ground water regime

txt: Oil Shale, 2006, Vol. 23, No. 1 ISSN 0208-189X pp. 3–14 © 2006 Estonian Academy Publishers THE IMPACT OF INFILTRATION DAM ON THE GROUNDWATER REGIME IN THE KURTNA LANDSCAPE RESERVE AREA Mining Department of Tallinn University of Technology Ehitajate tee 5, 19086 Tallinn, Estonia The area of Kurtna Landscape Reserve is situated between oil shale mines. This area is an important part of the Estonia deposit, and the located mining conditions there are good. Narva surface mine pumps groundwater from the area of Kurtna Lakes. It is able to minimize the influence of surface mining. Testing of mining technology and hydrogeological modelling show that mine front may be closed for stopping water flow instead of leaving an open trench by the border of the area of the lakes. According to modeling, hydraulic conductivity of the dam must remain 0.1 m/d to avoid sinking of water level in the lakes, and filtration basins must be supplied with water in an amount of 7000 m3 /d as yearly average. As the result, the landscape will be reclaimed, overall look and shape will be smoothed. Abandoned fields of peat milling will be reclaimed, and their fires will be avoided. Introduction The influence of the power and mining industry on Kurtna Lakes located in the centre of the oil shale mining area in North-East Estonia has been a discussion object for the last fifteen years. Oil shale mines surround the area of Kurtna Lakes. There are 40 lakes in a 30-km2 area above a 70-m deep buried valley [1]. Two mines – Estonia and Narva – exert the greatest influence on this. Both mines pump out water from the area and lead it back to the lakes or rivers in the same area. The question is how much the mining influences protected lakes and species. Besides Narva surface mine neighbouring the lakes has claimed the permission to pump groundwater from the lake area (see Fig. 1). Surface mining was stopped at a distance of 2 km from the protected area since the problem had not been solved, thus the mining company asked independent research groups to perform corresponding analyses and to test the mining technology used in this area. * Corresponding author: e-mail ingoval@cc.ttu.ee 4 I. Valgma, H. Torn, K. Erg Fig. 1. Location of the Kurtna Landscape Reserve, mining section and infiltration dam There are two main reasons for mining oil shale in the area. The first reason is oil shale resource. Local reserves represent an important part of the Estonia Oil Shale Deposit [2]. Energy rating of oil shale is one of the best among the potential mining areas reaching 44 GJ/m2 , and depth is relatively low (10 to 15 m) compared to 22 m in the rest part of the surface mining area [3, 4]. This resource is of great economical importance because when mined, total costs of mining will remain stable. On the other hand, pressure on mining oil shale in unsuitable areas will become actual in the future [5]. From these aspects, the application for mining permit is reasoned. Since Estonian main oil shale-fired power plant has been renovated, and new boilers require oil shale of a more stable quality than the former ones, the need for oil shale mining remains actual for at least 25 years, which corresponds to the resource in current minefields [6]. New power units operate applying a new, fluidised-bed technology that guarantees less impact on the environment. Total resources of oil shale in the Estonia deposit guarantee operating of power plants for 60 years [2, 5]. Due to low oil shale quality in the most part of the deposit and additional environmental restrictions, the quantity of mineable oil shale is not as great as it seems. Compared to 50% total loss of oil shale resource in the case of underground room-and-pillar mining, the loss in open cast mines reaches 30% [7]. The losses are due to differences in official and actual resources and oil The Impact of Infiltration Dam on the Groundwater Regime in the Kurtna Landscape Reserve Area 5 shale remaining in supporting, protective and barrier pillars. As for the usage of resources, surface mines are more valuable [8]. The main problems concerning mining fields are related to mining conditions and environmental restrictions. Surface mining is reaching depth limit, while underground mining is confronted by low quality of oil shale, bad roof conditions and environmental restrictions [4, 9]. For these reasons continuation of mining in the section neighbouring the area of Kurtna Landscape Reserve is advisable. Mining in the test section should be performed under continuous monitoring for calibrating dynamic modelling with groundwater software. Influence of oil shale mining on the area of Kurtna Landscape Reserve The influence of mining on the lakes has been investigated from the hydrogeological aspect, recommending the usage of infiltration basins and regulation of water flow [10–14]. Water chemistry has been investigated proceeding from the effect of oil shale mining on sulphate content of water [15]. The influence on the landscape and plants has been studied by analysing plant species and mining waste [16–19]. The set of water wells and lakes in the water monitoring program has been set to analyse changes in ecological situation. Unfortunately, it has not given a clear answer to the question about the influence of mining on the groundwater flow in the area. The reason for that has probably been complexity of situations and lack of an interested party who would evaluate all the aspects concerning this region. The closest lakes (Kastjärv, Aknajärv, Jaala, Kihljärv, Nootjärv, Valgejärv and Virtsiku) are located in a distance 1.5 to 3 km from the front of Narva surface mine. Data of observation wells show that the level has not been remarkably changed due to surface mining operation during the last five years. All these lakes are located in the area of boggy, glaciolacustrine and -fluvial deposits. Drawdown of groundwater has been formed due to an intensive consumption of groundwater at the water intake in the central part of the Vasavere buried valley. Quaternary aquifer is an unconfined waterbearing stratum. The values of porosity and permeability of Quaternary aquifer depend to a large extent upon the degree of sand cementation. Consequently, these values are generally expected to be much higher for the central part of the valley than for the slopes. A study of the samples shows that porosity values exceeding 33% are common for the central part, whereas those less than 20% are usual for the southern part of the valley. Similarly, intergranular permeabilities average 2500–2700 m3 d–1m–2 in the central part and drop to 10–50 m3 d–1m–2 at the border of the valley [20]. Seasonal factors, changing flow and various forms of recharge may all produce fluctuations in the water level of about 1 m. 6 I. Valgma, H. Torn, K. Erg 32 33 34 35 36 37 38 39 40 1999 2000 2001 2002 2003 2004 Water level, m Fig. 2. Sinking of water level shows sand inflow to the trench and quick normalisation of the state after closing the flow. Water wells B 6-1 ja B 6-2 are located between Lake Kastjärv and the dam Fig. 3. Technogenic valley formed after sand flow into the trench in March 1999 Water table of L. Valgejärv lowered 2 m in 1984, caused by water usage for stopping peat fires. For the year 1996, water level was normalised again. Only one remarkable event happened in 1999 when sand basement of the peat field flew into mining trench (see Fig. 2, 3). This happened because the spoil was piled on ice, and when ice melted sand spoil became unstable. The water-table diagram shows that original water level was restored quickly after closing sand inflow. The Impact of Infiltration Dam on the Groundwater Regime in the Kurtna Landscape Reserve Area 7 Mining technology The influence of Narva surface mine at the east side of the lakes’ area could be minimised. First, the mine front can be closed for stopping water flow instead of leaving an open trench in the border the area of lakes. Second, the overburden material that is used for closing the trench can be piled in such a way that it has lower permeability than soil in the nature. Besides, a part of that area is covered with abandoned fields of peat milling. Thickness of the residual peat layer reaches up to 3 m being a good material for decreasing permeability of the final dam material. For testing these assumptions, a test section was planned and designed by Mining Department of Tallinn University of Technology in 1997. The purpose was to test whether the filtration dam will decrease the sinking of water level in the area. Test mining in this section started in 1998. The idea originated from dam-piling experiences in the same mine where a dam has been piled with careful dumping and mixing of overburden material (see Fig. 4). This resulted in accumulation of water behind the dam, a water body now called Lake Vesiloo named after the designer of the dam. Water level in the upper lake has remained stable for 45 years, which proves permeability of piled overburden material consisting of limestone, clayey sand and peat. For evaluating the influence of mining on a larger area, a modflowgroundwater model was set up by independent company AS Maves in cooperation with Mining Department of Tallinn University of Technology [19]. The model is supported by continuous monitoring of water wells and mine-dewatering data. For closing the existing open trench, placement of mine front and stripping technology were changed. The direction of mine front had to be changed by 45 or 90 degrees (see Fig. 5). This could enable building of an infiltration barrier between the lakes and the mine at the end of the trench where only a 30-m-wide pit would be temporarily opened for water infiltration. 36.1m 30.3m Spoil 5.8m Bank Mine bottom Infiltration dam Vesiloo lake Fig. 4. Cross-section of infiltration dam in the mined-out area of Viivikonna section. Water level in Lake Vesiloo has remained 6 m higher from water level in lower lake for 45 years 8 I. Valgma, H. Torn, K. Erg Fig. 5. Layout of water inflow to the mine applying old technology (above), new technology (below) Dragline ES-10/70 is used for piling the dam. Ordinary selective piling of the overburden will be finished at 50 m from the border. Beginning from this point, the material will be disposed homogeneously. Different materials are dumped on top of each other. This should guarantee low permeability of the dam. Important is that the material be dumped from the maximum height of dumping position of the dragline and onto different locations. The width of the dam should be at least 25 m, and the high wall should be covered with a mixture of clayey material and peat. Stripping productivity in the section will be decreased by several factors. Dragline’s cycle time increases because of hauling of the bucket to the maximum height of the dump, repositioning of the boom in every cycle, and careful monitoring of homogenisation of the spoil. Besides, technology of seam extraction in the dam area is affected by many factors. Oil shale interlayer C/D has to be hauled away from the location of the dam because of its high swelling value (up to 200%). Hydraulic conductivity The Impact of Infiltration Dam on the Groundwater Regime in the Kurtna Landscape Reserve Area 9 of this loose material could reach 1000 m/d. Alternatively, the seam has to be extracted non-selectively, leaving a 30-cm limestone layer in the output material. The overall productivity will decrease because the trench is short – 700 m, the optimum length being 1.5 km [21]. This concerns organising stripping, haulage and dam operations in a short section. Optimum length of the section was achieved by positioning the trench at 45 degrees instead of planned 90° in relation to the original North-South direction. (see Fig. 5) The groundwater model was made on several assumptions. Groundwater discharge from the mine should be within certain limits to keep the decrease in the water level of the lakes below the agreed limits. According to the model, hydraulic conductivity of the dam material should not exceed 0.1 m/d. Besides, infiltration basins which are located between the mine front and the lakes should be fed with water in an amount of 7000 m3 /d for complementing soil water of the surroundings and keeping water level in the area stable. Dam material consists of silty fine-grained sand whose modulus of hydraulic conductivity k = 0.1–0.8 m/d depending on density and compaction index of the material, and the content of clay particles. Provided that the test section was piled according to the design, the modulus of hydraulic conductivity of the material in this section could be in limits k = 0.1–0.2 m/d. In addition, the overburden contains moraine (k = 0.01–0.05 m/d), fine-grained sand (k = 0.5–2 m/d) and loose broken limestone (k = 100 m/d). Spoil material dumped conventionally is characterised by k = 0.5–50 m/d. It is assumed, basing on the experience gained from the test section, that fine material will fill spaces in coarse material decreasing permeability of the bank dam. The given solution will not work with drains that could form in the case of piling C/D layer, or with open dewatering tunnels under oil shale bed. The influence of mining on water level and quality of lake water near the test section is unnoticeable that proves the suitability of the technology. However, the conditions will become more complicated in southern direction (see Fig. 6). There are peat, sand and moraine layers in the cross section of the Quaternary sediments and Ordovician limestone in hard overburden, causing high permeability of the spoil. An increase in the thickness of limestone seam in southern direction causes most of the dumping problems in dam building. Additional amounts of sand have to be scraped from aside, probably rehandling the overburden, and, in addition, compactors should be used for achieving proper modules of hydraulic conductivity. Dam piling was modelled applying the geometric model that is used for determining the ultimate pit depth for draglines [9]. The model yields figures about suitability of draglines, need for rehandling and additional scraping, and also differences in the final height of the ground (see Figures 7 and 8). The test section has shown that it is difficult both organisationally and technologically to establish all these parameters. For evaluating the effectiveness of the dam in the southern part, several tests on density, compression and permeability of the spoil material have to be performed and compared with data obtained using the hydrogeological model. 10 12 17 22 27 32 37 42 47 Height, m Soft overburden 13.9 15.5 13.6 10.8 10.9 Hard overburden 5.1 4.2 8.0 9.9 12.1 Oil shale seam 2.8 2.8 2.8 2.8 2.8 Bottom layer 23.2 22.3 19.2 17.5 13.6 1-North 2 3 4 5- South Fig. 6. Thickness of limestone overburden increases in southern direction causing dumping difficulties for draglines and higher hydraulic conductivity of overburden material Fig. 7. Pit at the end of the trench before 1997. Limestone pile on the bottom of the trench forms under spoil drainage channels If the technology of dumped spoil fails, the compactors on the spoil and a geomembran barrier on the bank wall made using contour blasting, or a clay barrier must be applied. The Impact of Infiltration Dam on the Groundwater Regime in the Kurtna Landscape Reserve Area 11 0 10 20 30 40 -100 -80 -60 -40 -20 0 20 40 60 Dragline center Spoil Bank Length, m Fig. 8. Pit layout and modelling of surface height using geometrical model Different materials and constructions are widely used to reduce hydraulic permeability at exploitation of mines, quarries and waste depositories. Depending on purposes, the barriers, dams, sheet piles or cut-off walls of different permeability could be constructed. In Estonia, hydraulic barriers are designed and constructed around Sillamäe Radioactive Waste Depository (bentonite slurry cut-off wall) and Tallinn old municipal landfill (vinyl sheet-pile wall). Watertight clay barriers are widely used in construction of new landfills. Vertical slurry cut-off walls Slurry cut-off walls are vertical walls constructed by excavating a trench and simultaneously filling the trench with a bentonite slurry. The bentonite slurry forms a thin (typically ≤3 mm) filter cake of low hydraulic conductivity (
Tellimine:
Postitused (Atom)